Adding the Palo Alto Network Firewall Dashboard
Go to Settings >> Knowledge Base from the navigation bar and click Dashboard.
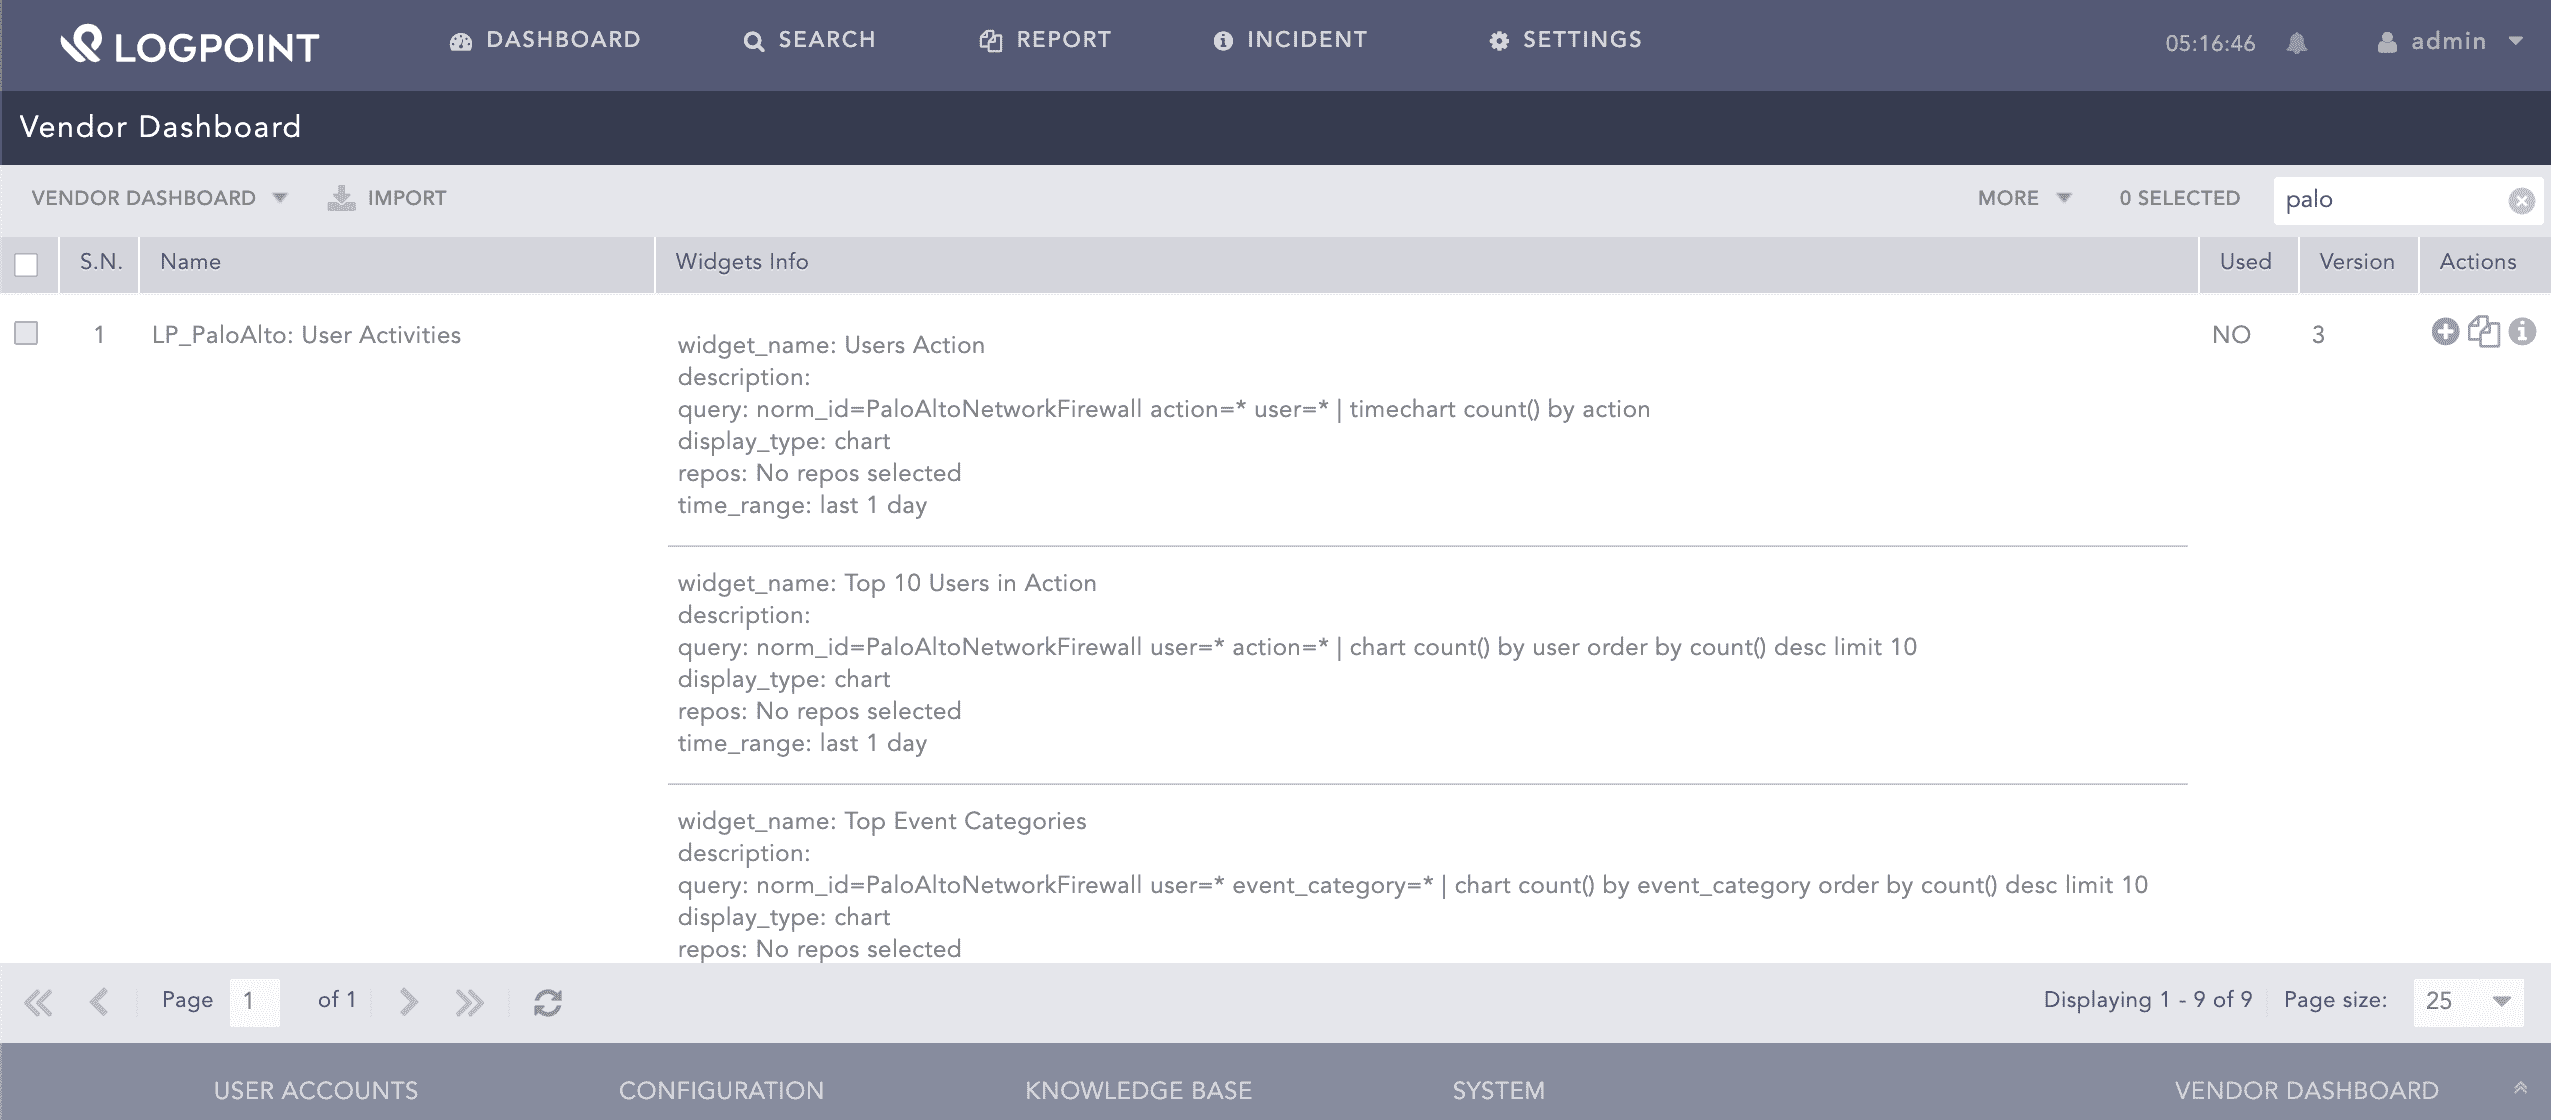
Select VENDOR DASHBOARD from the drop-down.
Click the Use icon from Actions.
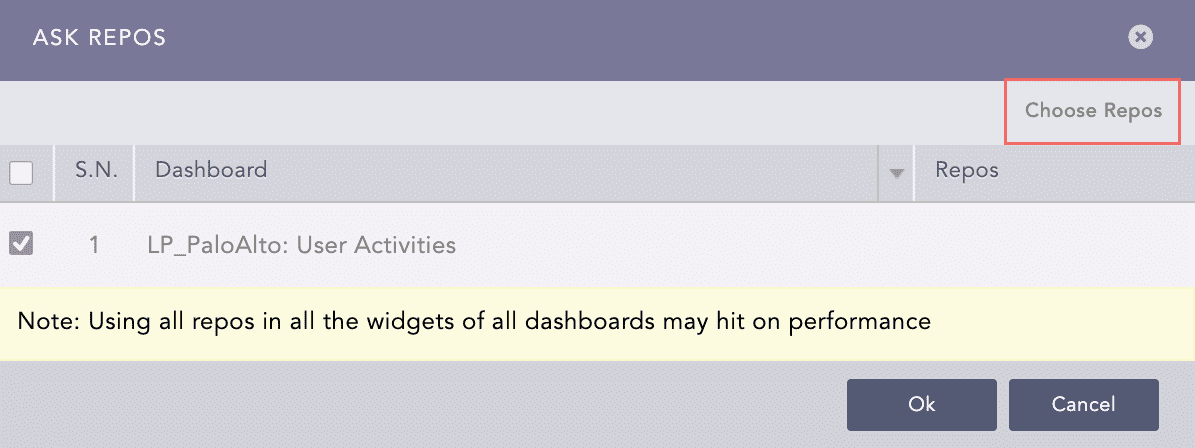
Click Choose Repos.
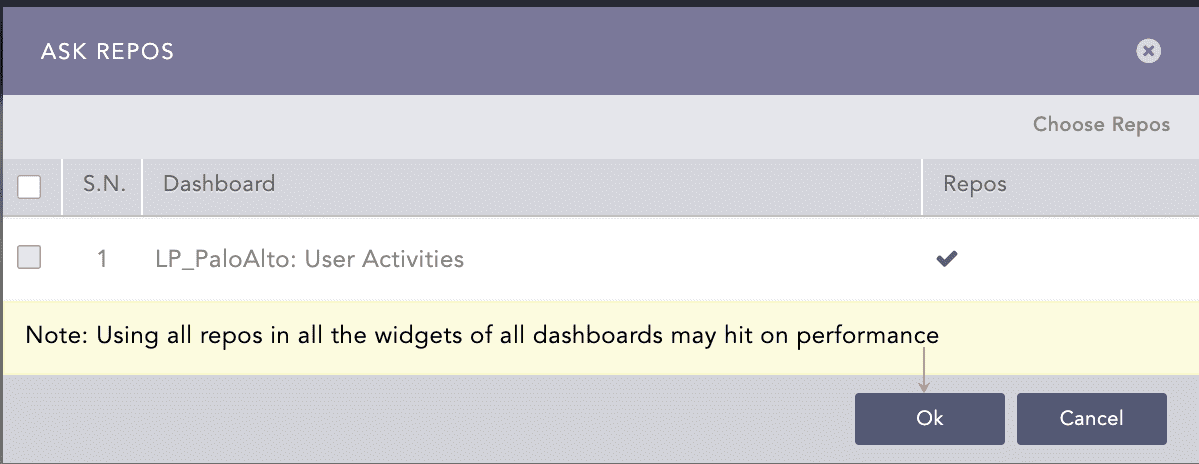
Select the repo and click Done.
Click Ok.
You can find the Palo Alto Network Firewall dashboards under Dashboards.
Widgets available in LP_PaloAlto:User Activities provide:
Widget Name |
Description |
|---|
Users Action |
An overview of actions performed by users on your network such as allow or block. |
Top 10 Users in Action |
An overview of the top 10 most active users on your network. |
Top Event Categories |
An overview of the top event categories such as security events, policies events, monitor events, or settings events. |
Top 10 Web Categories |
An overview of the top 10 URL categories such as web advertisements, social networking, or news. |
Top 10 Domain Accessed |
An overview of the top 10 URLs searched by users. |
Application not using Default Port |
An overview of applications with its traffic on a non-standard destination port. |
Top 10 Content Types |
An overview of the top 10 content types such as insufficient content. |
Potential Data Leakage |
An overview of potential data leakage based on applications, users, files, and source addresses. |
Rare Application |
An overview of applications that are rarely used by users along with their sub-category such as virus, spyware, or vulnerability. |
Multiple Failed User Authentication |
An overview of failed authentications that occurred within an hour for the same user. |
Longest Sessions by User |
An overview of web sessions that lasted longer than usual for a user. |
Widgets available in LP_PaloAlto:File Activities provide:
Widget Name |
Description |
|---|
Actions on File |
An overview of actions performed on a file such as continue or block. |
Top 10 Files in Action |
An overview of the top 10 files where large set of actions have been performed. |
Data Volume Transferred |
An overview of file transfer volume in MB. |
File Activities |
An overview of activities performed on files based on the size of file transferred or received, user, action, application, source address, destination address, source zone, and destination zone. |
Top 10 Files With Unique Hash Executed |
An overview of the top 10 files with unique hash value ordered by their execution count. |
Widgets available in LP_PaloAlto:Firewall provide:
Widget Name |
Description |
|---|
Actions - Timetrend |
A time trend for actions performed on firewall such as default, drop, or reset. |
Top 10 Threats by Source Location |
An overview of the top 10 threats based on the source location. |
Top 10 Threats by Applications |
An overview of the top 10 applications that were blocked from entering the network. |
Top 10 Security Event Activity |
An overview of threat IDs, URLs, and actions that were denied access into your network. |
Threat Data Events by User |
An overview of events labeled as threat. |
Top 10 Applications by FW Events |
An overview of the top 10 applications that were blocked, allowed, or denied by the firewall. |
Top 10 Firewall Rules Fired and Action Taken |
An overview of actions taken against triggered firewall rules. |
Widgets available in LP_PaloAlto:Config Overview provide:
Widget Name |
Description |
|---|
Top 10 Blocked Applications by Bandwidth |
An overview of the top 10 applications blocked by firewalls as they require a substantial amount of bandwidth. |
Top 10 Allowed Applications by Bandwidth |
An overview of the top 10 applications that consume less or moderate bandwidth. |
Top 10 Blocked Applications |
An overview of applications blocked by the firewall. |
Top 10 Denied Connections by Country |
An overview of the top 10 countries with denied connections. |
Heaviest Usage of Skype |
An overview of source addresses with high usage of Skype. |
Heaviest usage of Dropbox |
An overview of source addresses with high usage of Dropbox. |
Traffic Over Time |
An overview of the flow of traffic in a network over time. |
Severity by Protocol |
An overview of protocols based on their severity. |
Multiple Failed Authentication From Source |
An overview of the source address with multiple failed user authentication. |
Widgets available in LP_PaloAlto: General provide:
Widget Name |
Description |
|---|
Config overview - List |
A detailed overview of changes made to the firewall configuration. |
Admin User Activities - Timetrend |
A time trend of admin performing the configuration. |
Top 10 Clients |
An overview of the top 10 clients such as web or CLI. |
Top 10 Results |
An overview of the top 10 results after changes are made to the firewall such as submitted, succeeded, failed, or unauthorized. |
Widgets available in LP_PaloAlto:Content Overview provide:
Widget Name |
Description |
|---|
Web Activity - List |
A detailed overview of web activities based on applications, URL IDs, categories, IP addresses, and actions. |
Widgets available in LP_PaloAlto:Threats provide:
Widget Name |
Description |
|---|
Threats by Category - Timetrend |
A time trend of threats by their category such as malicious or benign. |
Risk Values (High and Low) |
A detailed overview of threat severity. |
Top 10 Actions |
An overview of the top 10 threat actions such as alert, drop, or allow. |
Top 10 Threat Applications |
An overview of the top 10 applications that were denied on your network. |
Top 10 Targeted Users |
An overview of users that were targeted by threats. |
Top 10 Threat Sources |
An overview of the top 10 source addresses that initiated activity on a network. |
WildFire Submission |
An overview of applications submitted for WildFire submission as Malicious, Phishing, Graywire, or Benign. |
Top 10 Threat Categories |
An overview of the top 10 threat categories such as malicious, benign, or phishing. |
Top 10 Threat Destinations |
An overview of the top 10 destination IP addresses accessed by threat. |
Top 10 Vulnerable Files |
An overview of the top 10 files that are vulnerable to threats. |
Email Threats |
An overview of emails from potential threats. |
WildFire Details |
A detailed overview of files or applications that generated the WildFire submission and information on a user, IP address, ports, application, file, and hash. |
Top 10 Source Countries |
An overview of the top 10 countries that are most used for allowing traffic into the network. |
Top 10 Destination Countries |
An overview of the top 10 countries that are most used by traffic going outside the network. |
Widgets available in LP_PaloAlto:Traffic provide:
Widget Name |
Description |
|---|
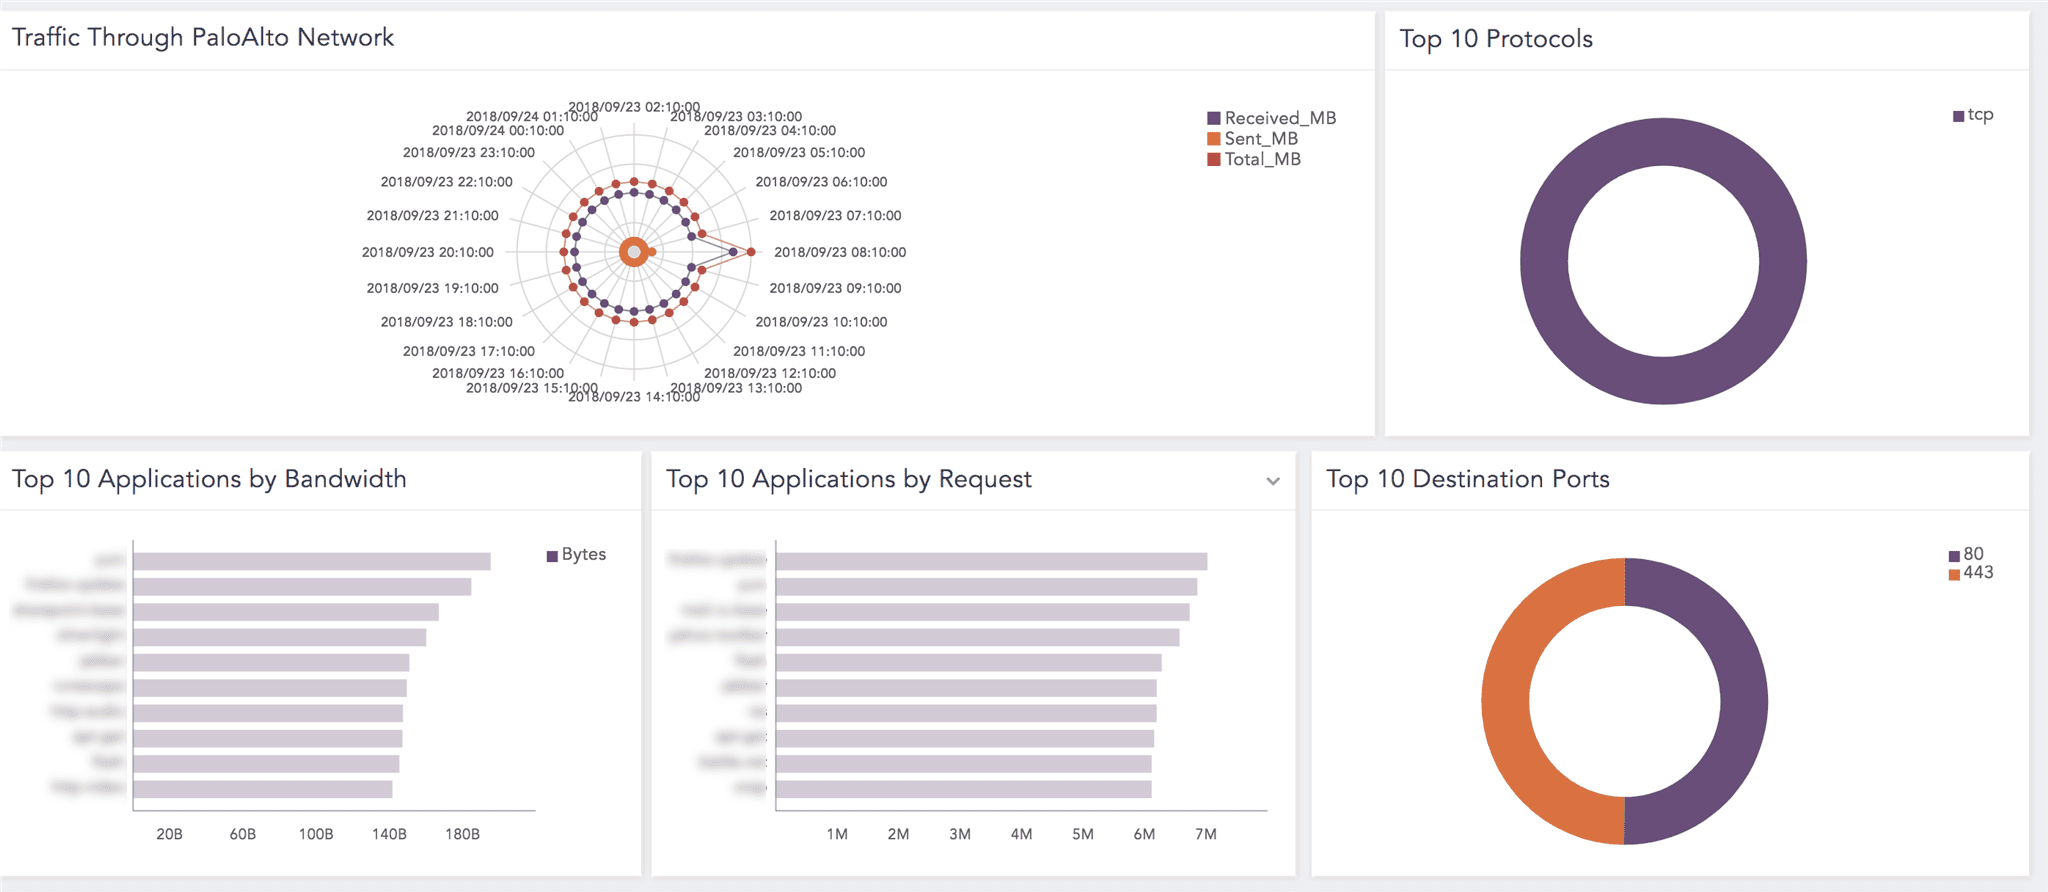
Traffic Through PaloAlto Network |
An overview of traffic from Palo Alto Network Firewall. |
Top 10 Protocols |
An overview of the top 10 protocols associated with the session such as TCP or UDP. |
Top 10 Applications by Bandwidth |
An overview of the top 10 applications based on their bandwidth usage. |
Top 10 Applications by Request |
An overview of the top 10 applications that allowed the most traffic on their network. |
Top 10 Destination Ports |
An overview of the top 10 destination ports with high traffic volumes. |
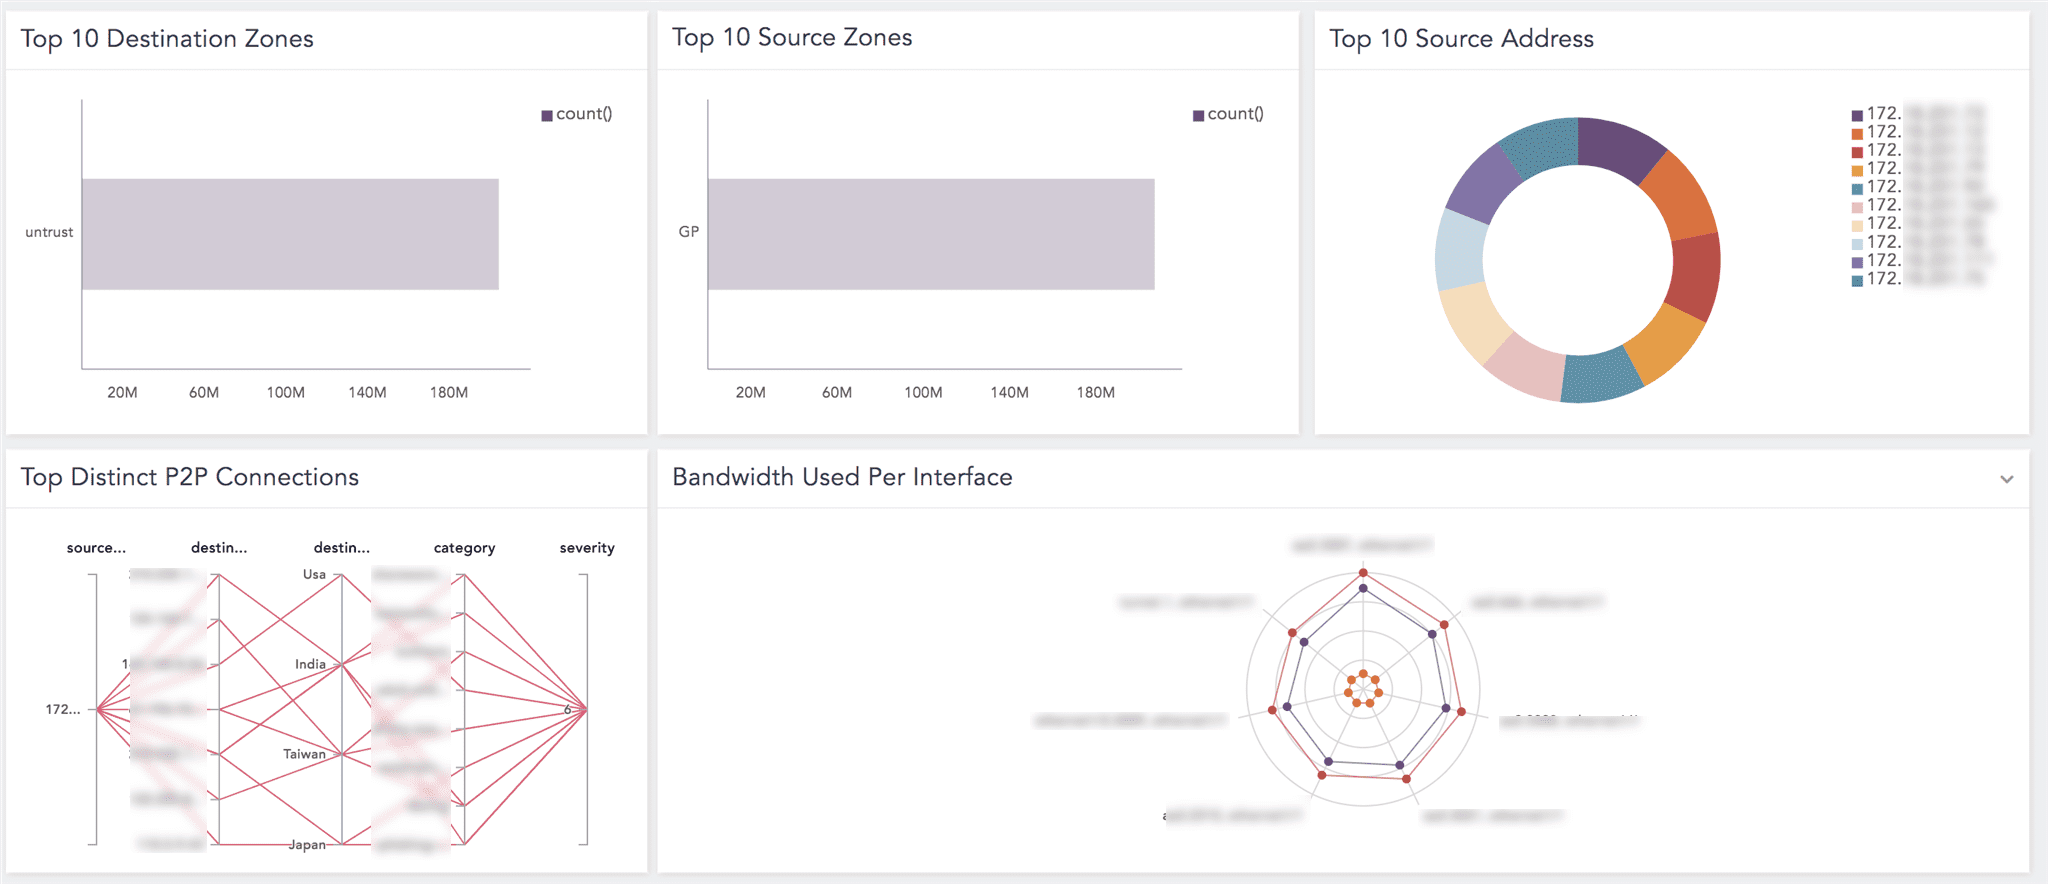
Top 10 Destination Zones |
An overview of the top 10 zones that allowed the most traffic into their networks. |
Top 10 Source Zones |
An overview of the top 10 zones that are most used by traffic going outside the network. |
Top 10 Source Address |
An overview of the top 10 source addresses with the high rate of traffic flow. |
Top Distinct P2P Connections |
An overview of the leading distinct Peer to Peer (P2P) connections between server to client based on source address, location, and severity. |
Bandwidth Used Per Interface |
An overview of bandwidth usage dedicated for different network-related functions such as SSL or SMTP. |
Top 10 Connections |
An overview of the top 10 connections established. |
Most Repeated Connection Profiles |
An overview of connections with the same profile within five seconds interval. |
Top 10 Session End Reasons |
An overview of the top 10 reasons for sessions to end. |
Widgets available in LP_PaloAlto: System Overview provide:
Widget Name |
Description |
|---|
Count by Hosts - Timetrend |
A time trend of hosts count information. |
Severity - Timetrend |
A time trend of severity. The severity ranges from 0 to 7, where 0 represents emergency, 1 represents alert, 2 represents critical, 3 represents error, 4 represents warning, 5 represents notification, 6 represents informational, and 7 represents debugging. |
Top 10 Sub-categories |
An overview of the top 10 sub-categories such as dnsproxy, userid, or vpn. |
Top 10 Event_IDs |
An overview of the top 10 event IDs; string with the name of the event. |
Successful Users Login - List |
An overview of successful user logins. |
Users Login Failed - List |
An overview of failed user logins. |
Top Actions - List |
An overview of the top actions such as default, alert, or allow. |
Top Actions or Status of Objects - List |
An overview of the top actions or status of objects such as drop with a success status. |
Top 10 HIP Match |
An overview of the top 10 Host Information Profile (HIP) matches upon successful connection of the GlobalProtect gateway with the host. The GlobalProtect HIP feature can collect information about the endpoints’ security status, such as installing the latest security patches or disk encryption enabled. |
Using the Palo Alto Network Firewall Report Templates
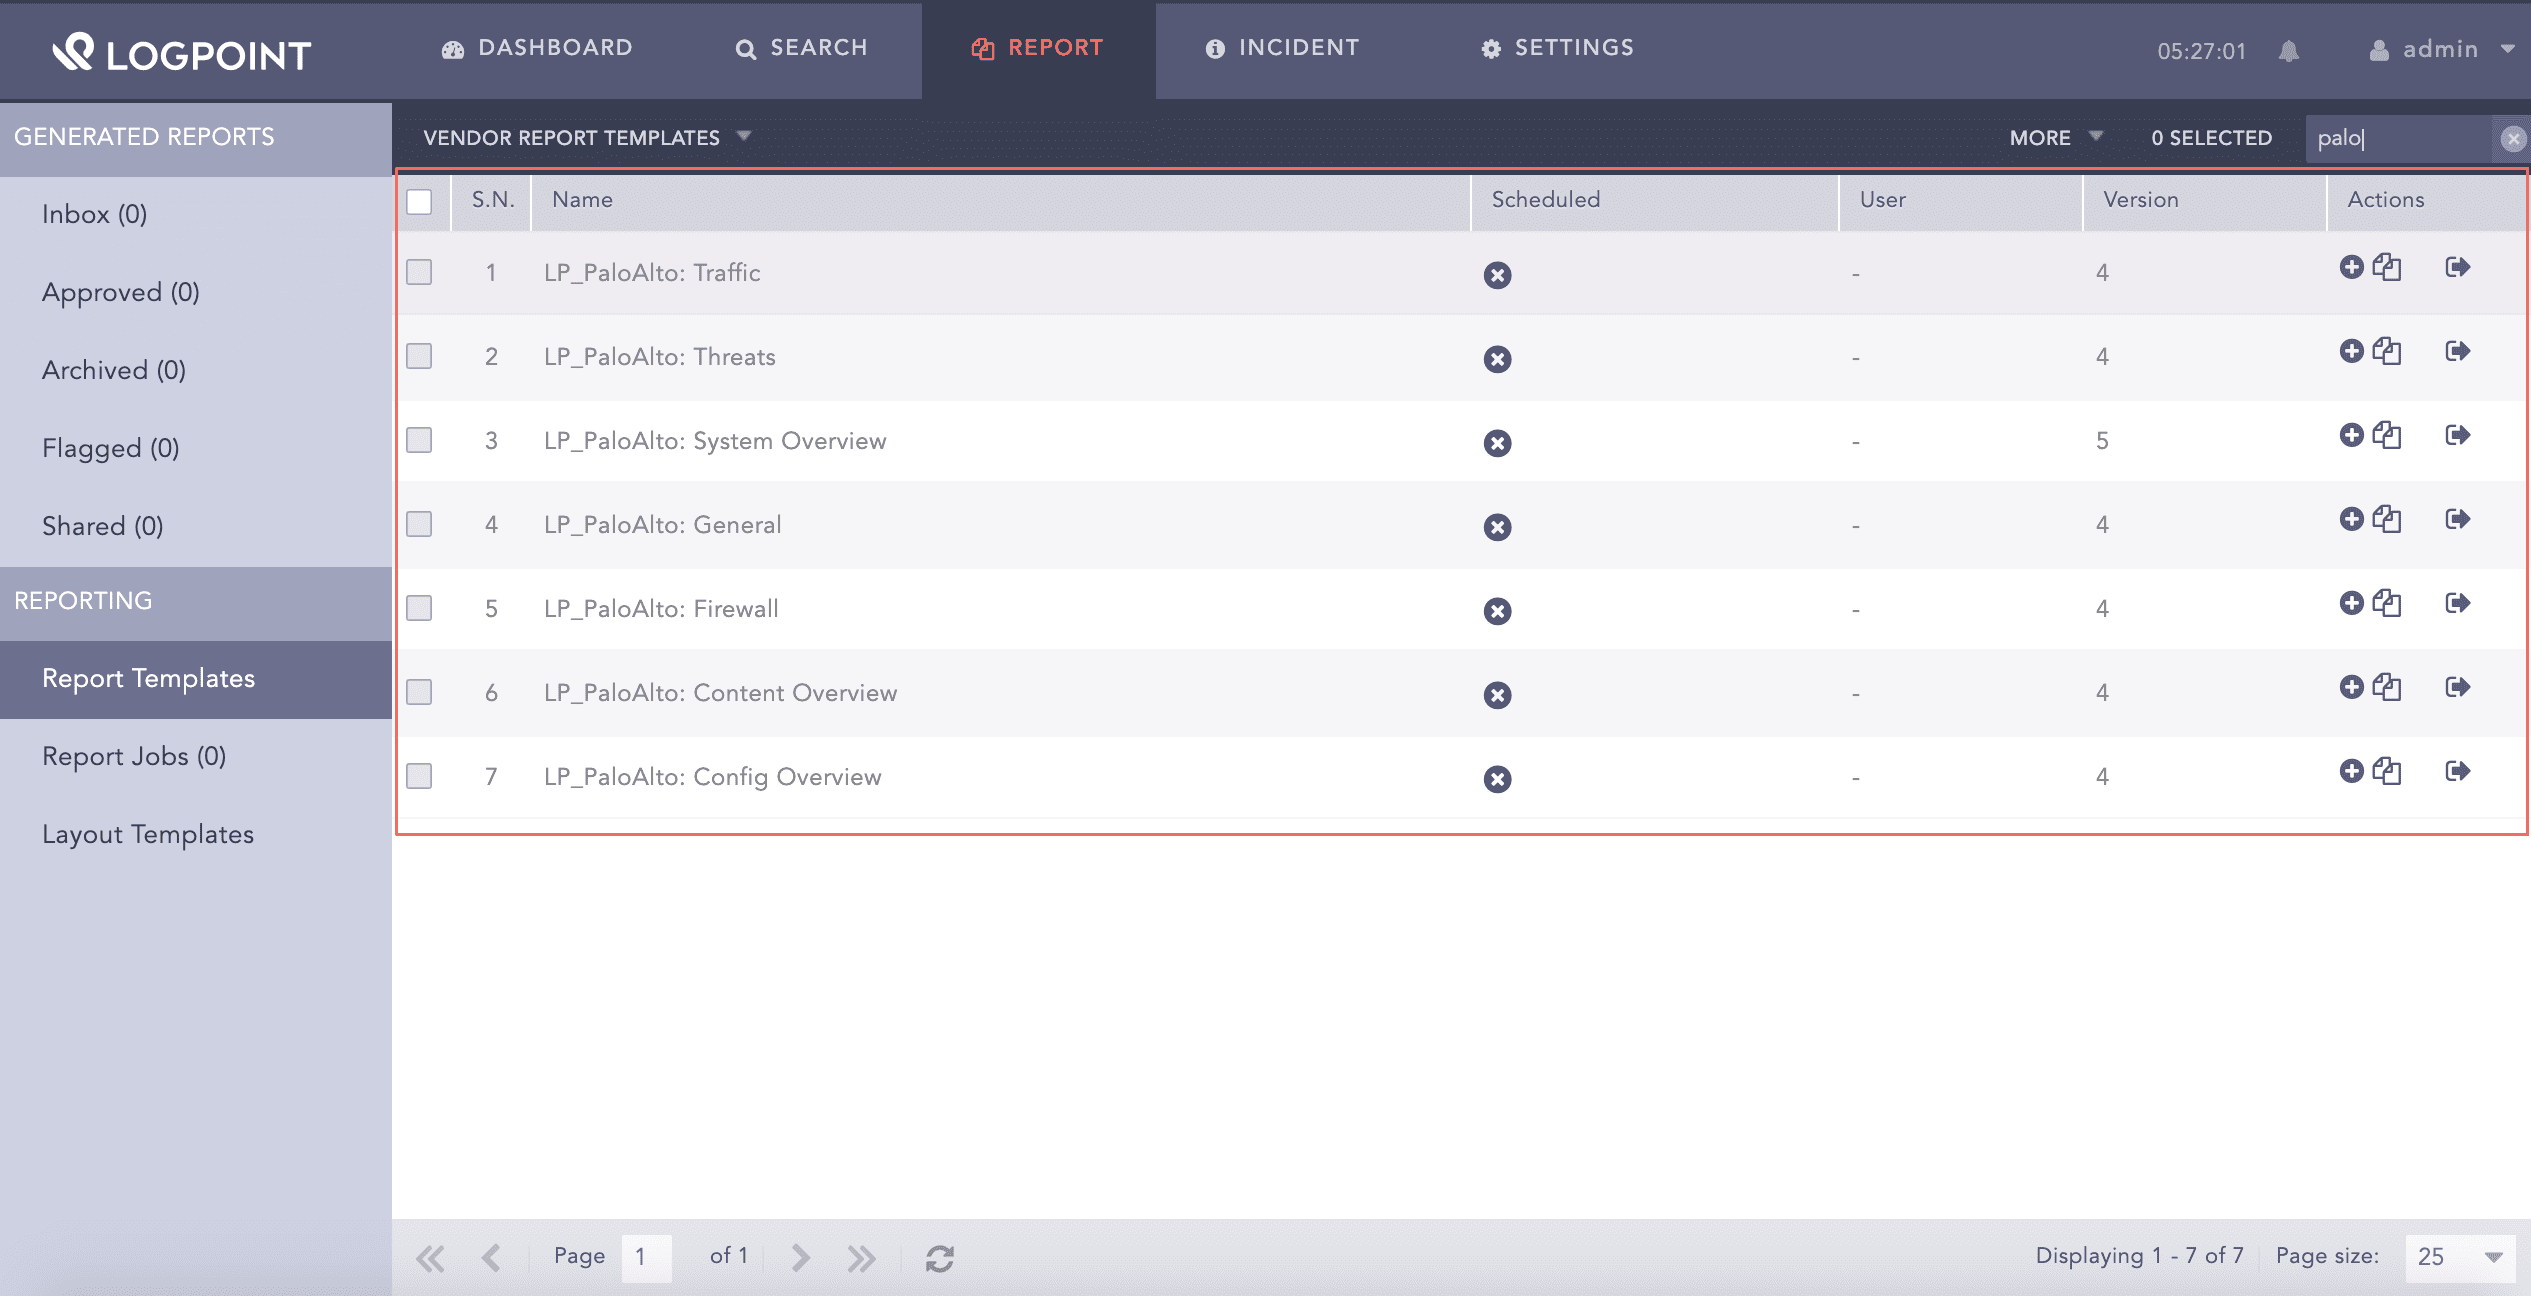
Go to Report >> Report Template>>Vendor Report Templates.
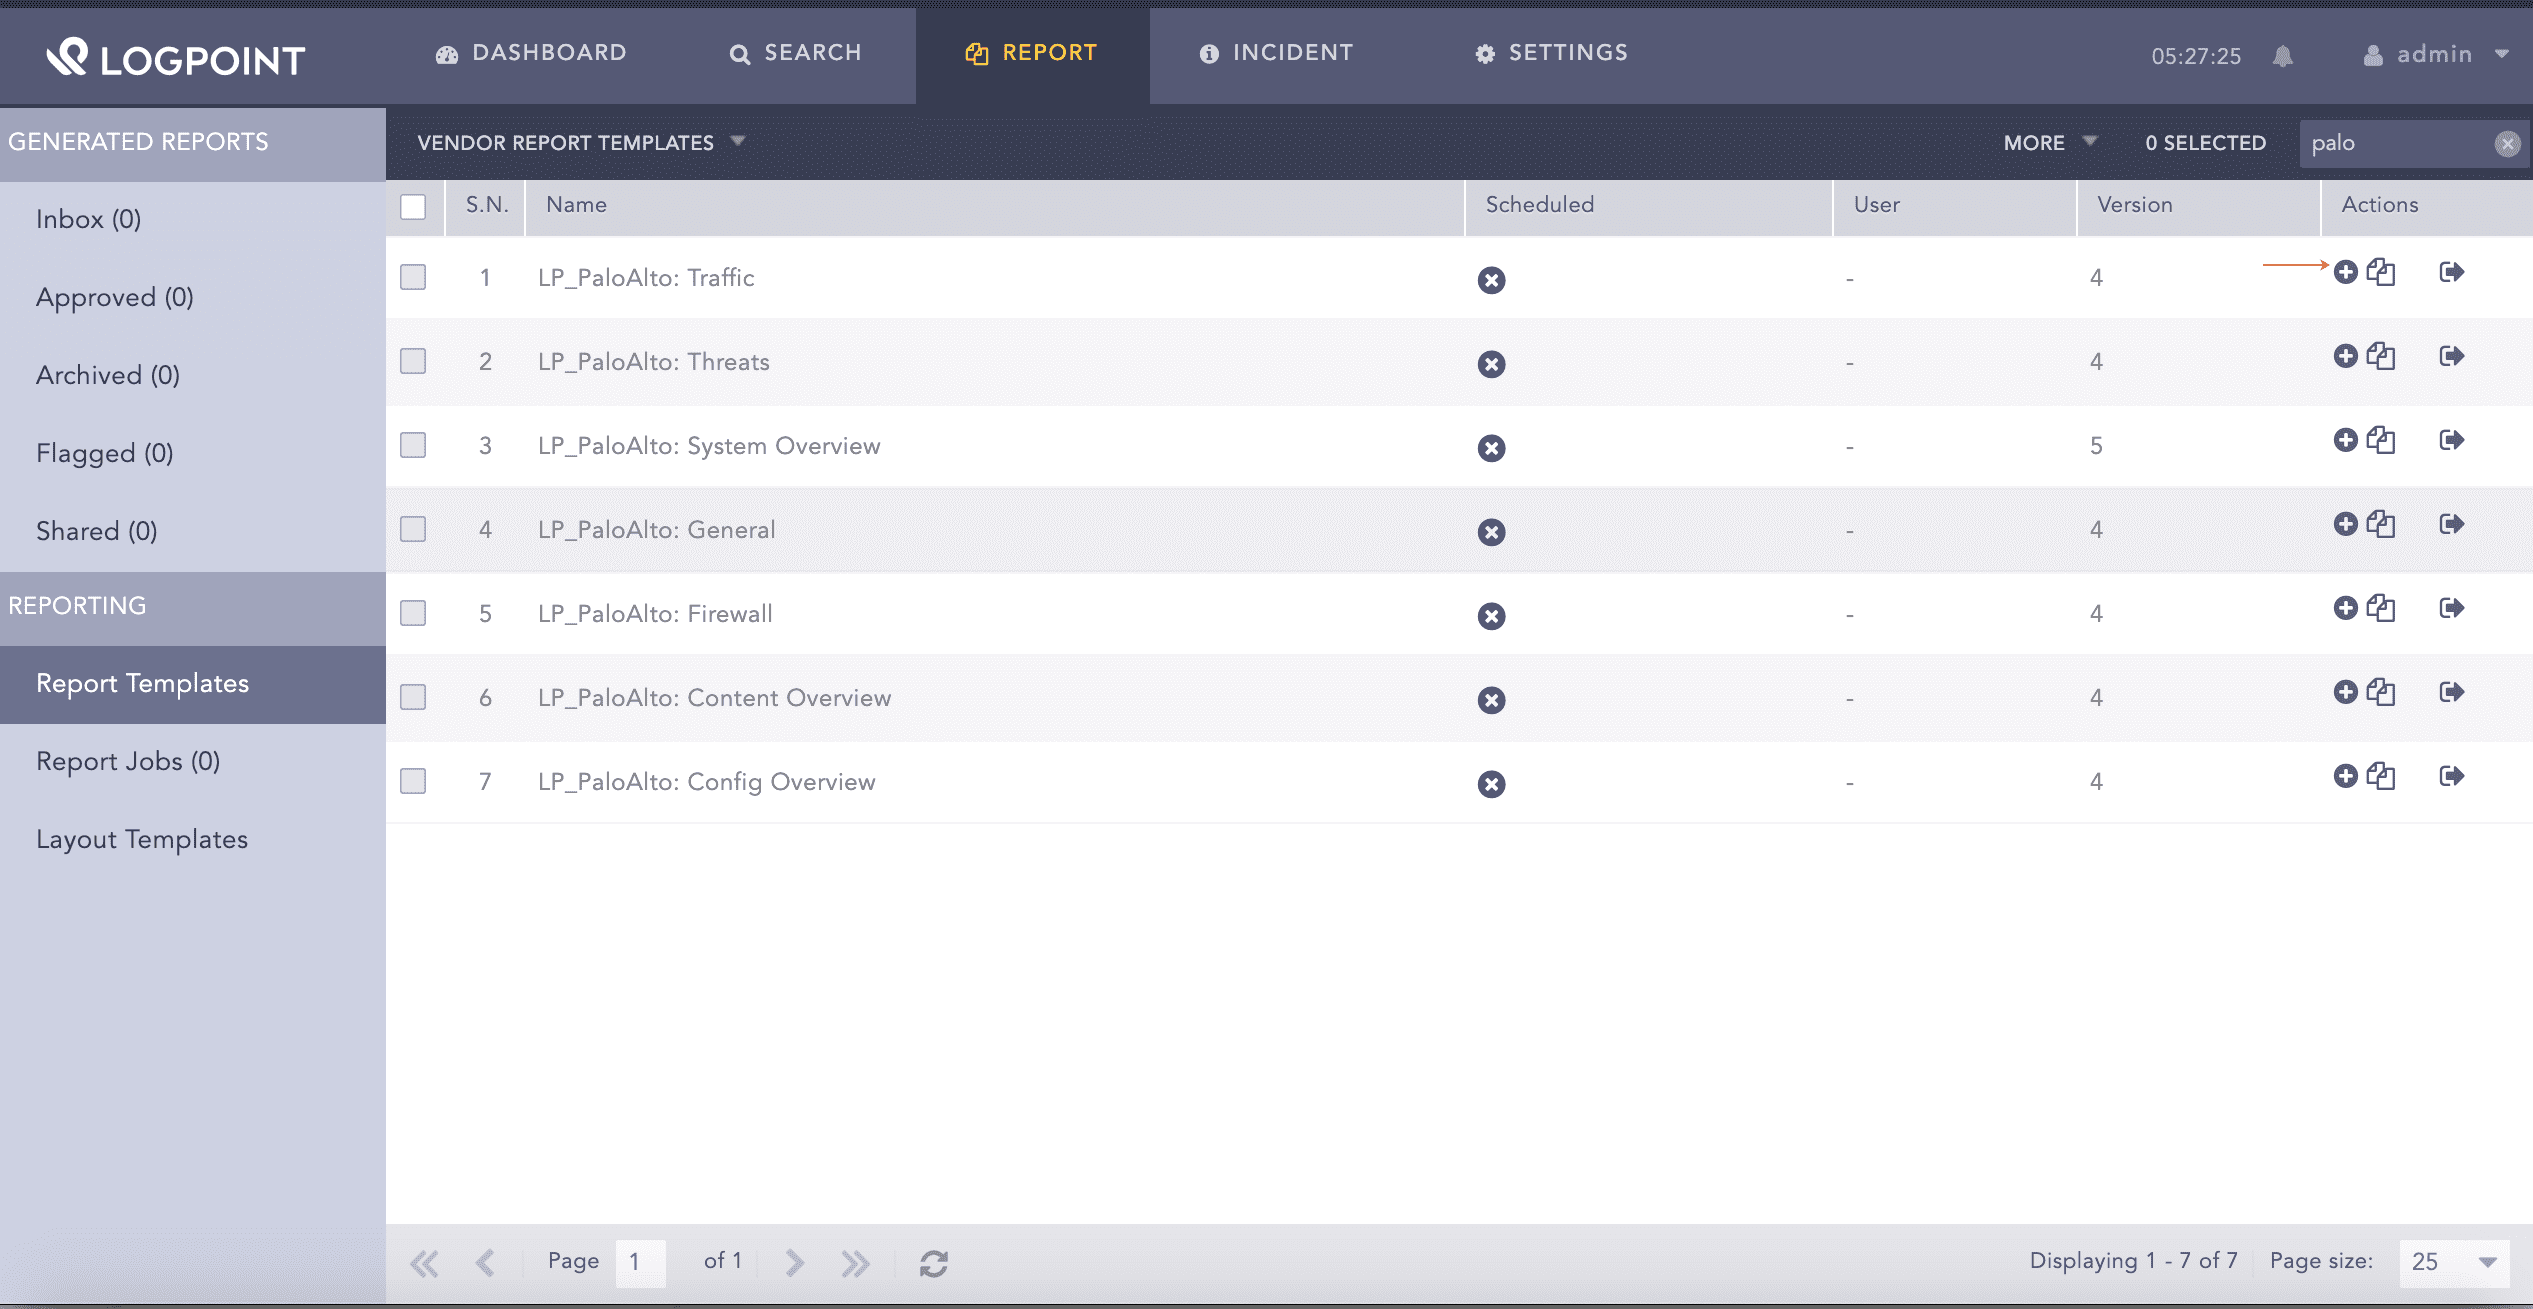
Click Add under the Actions column.
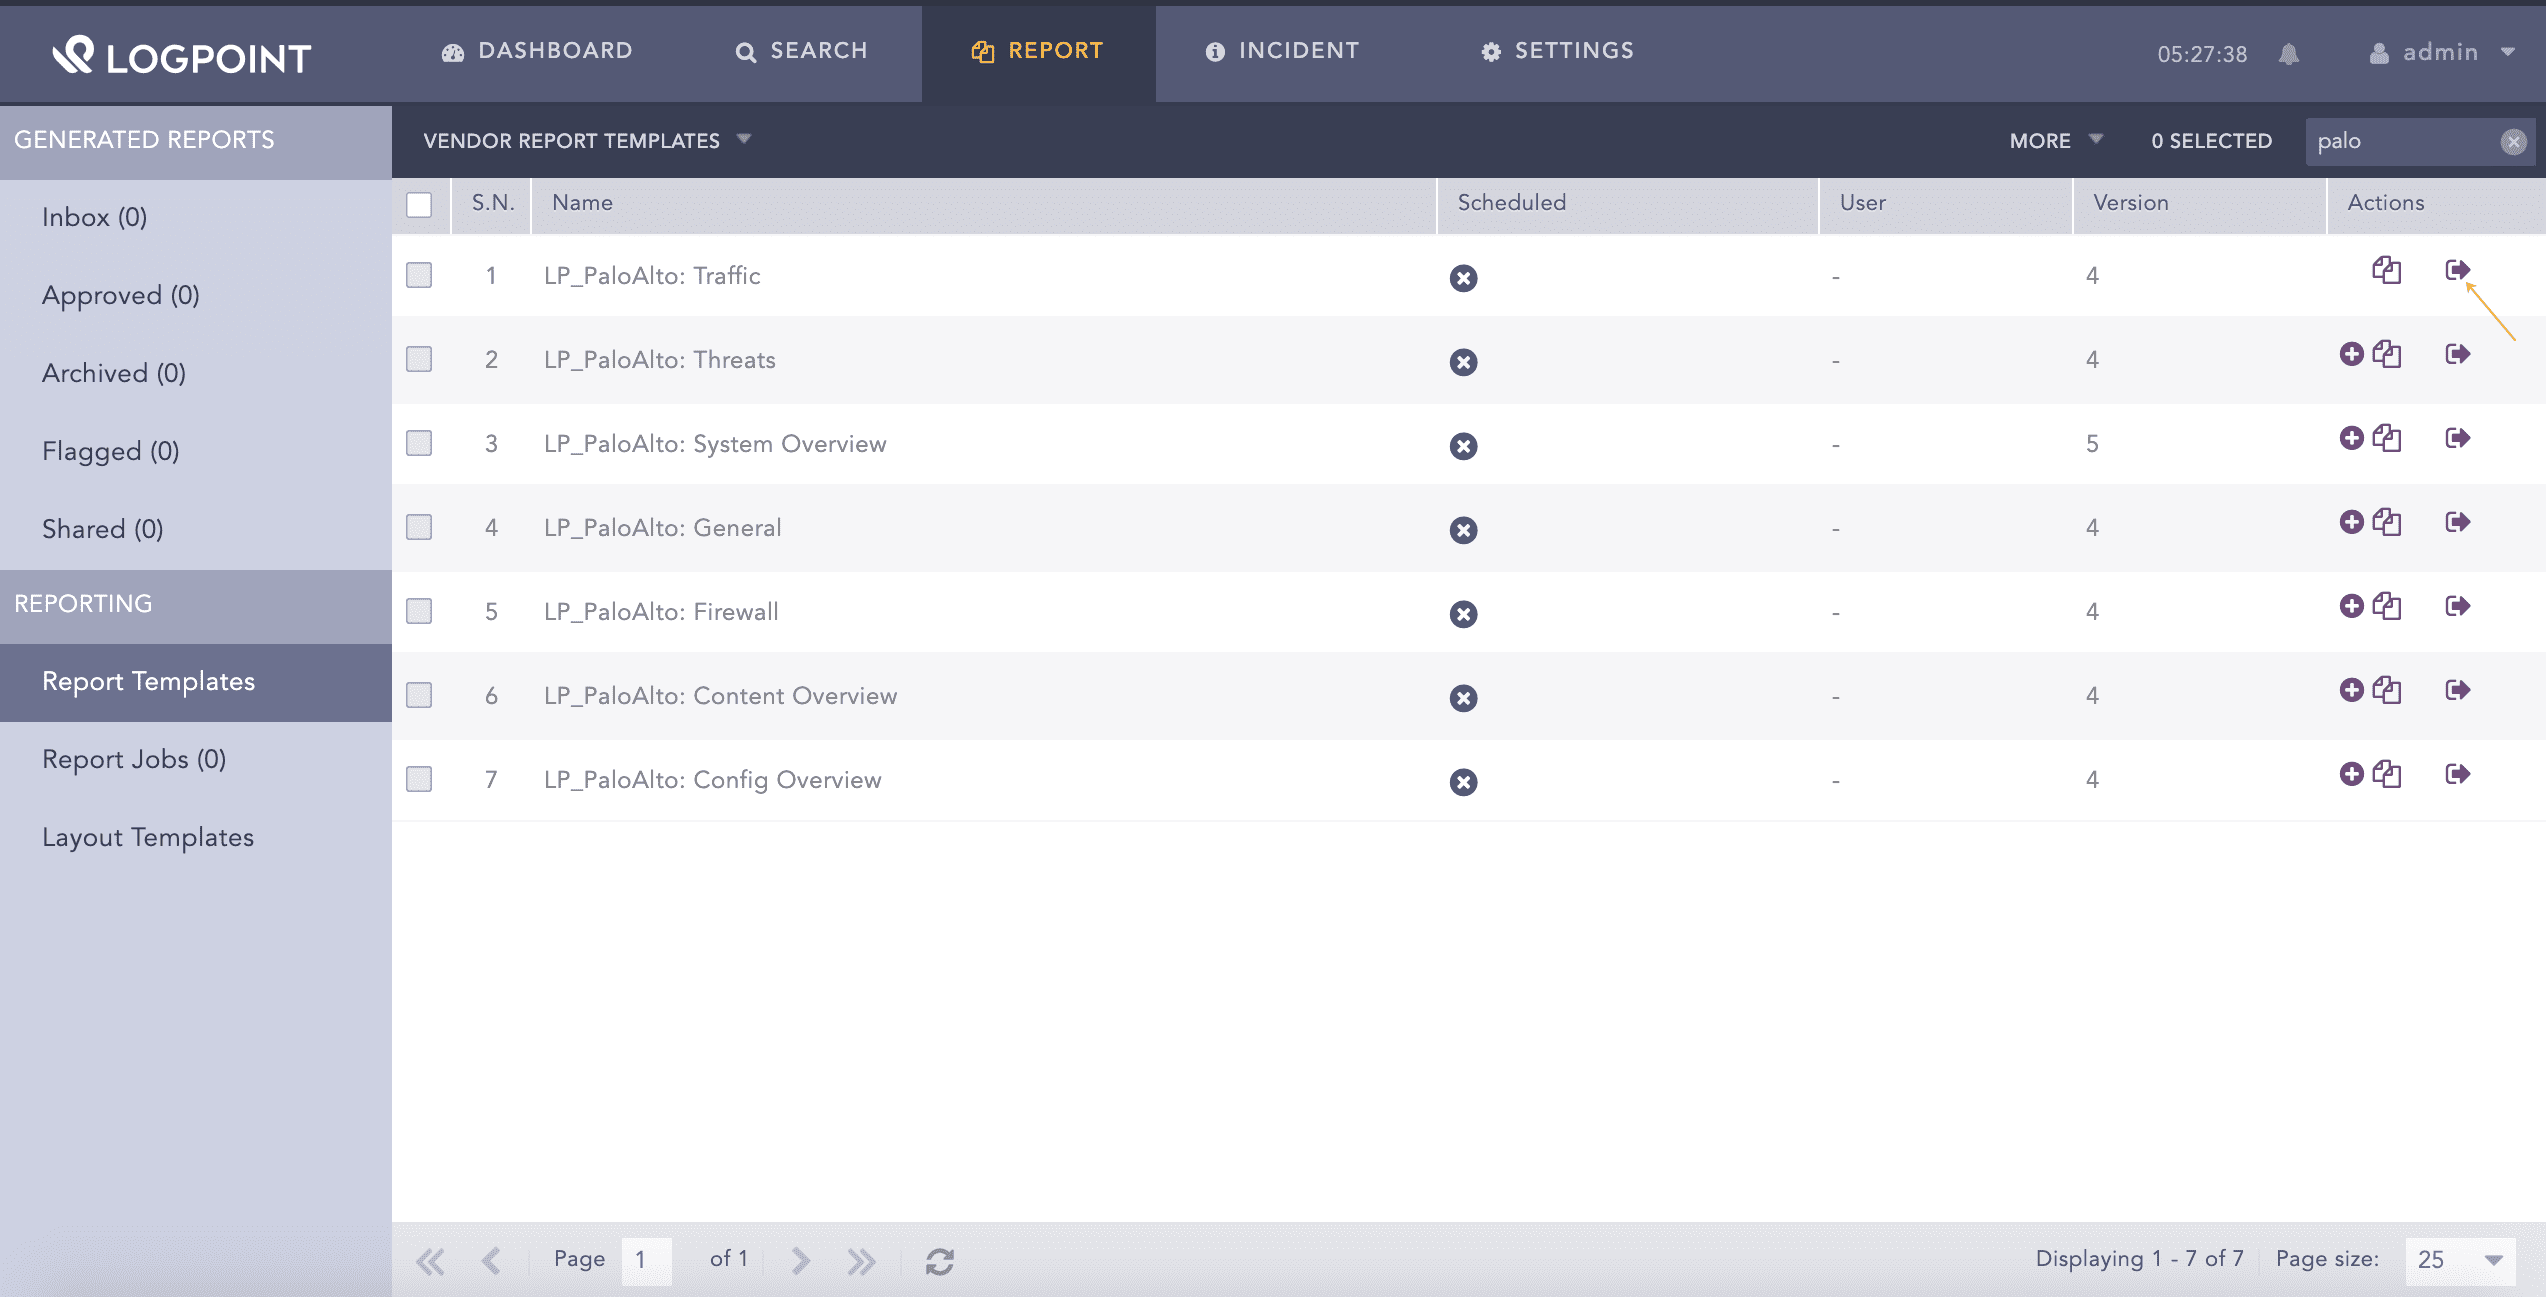
Click Run this Report under the Actions column.
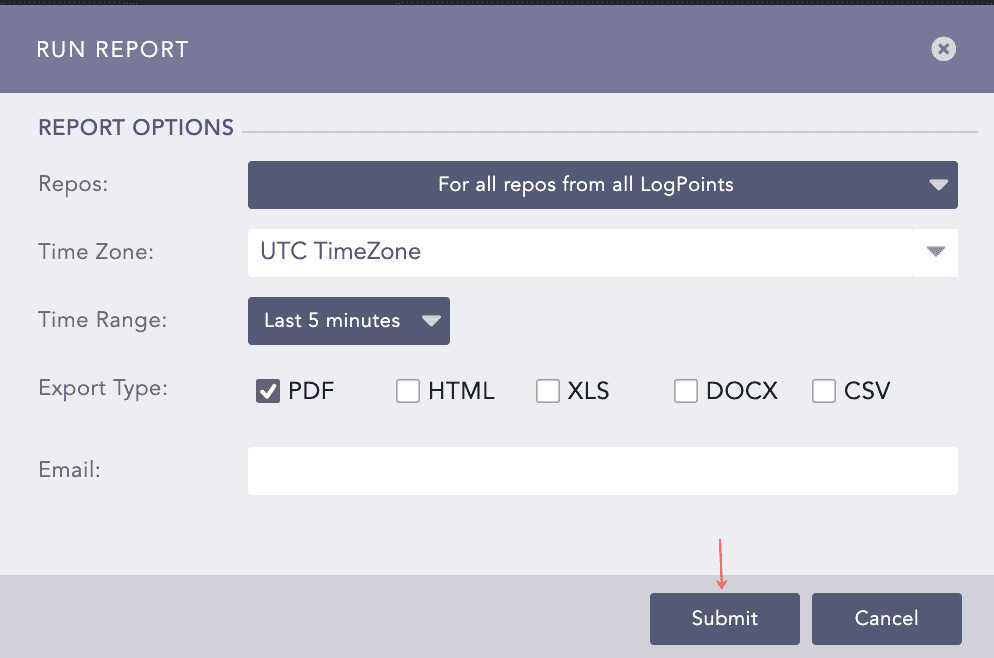
Select Repos, Time Zone, Time Range, Export Type, and Email.
Click Submit.
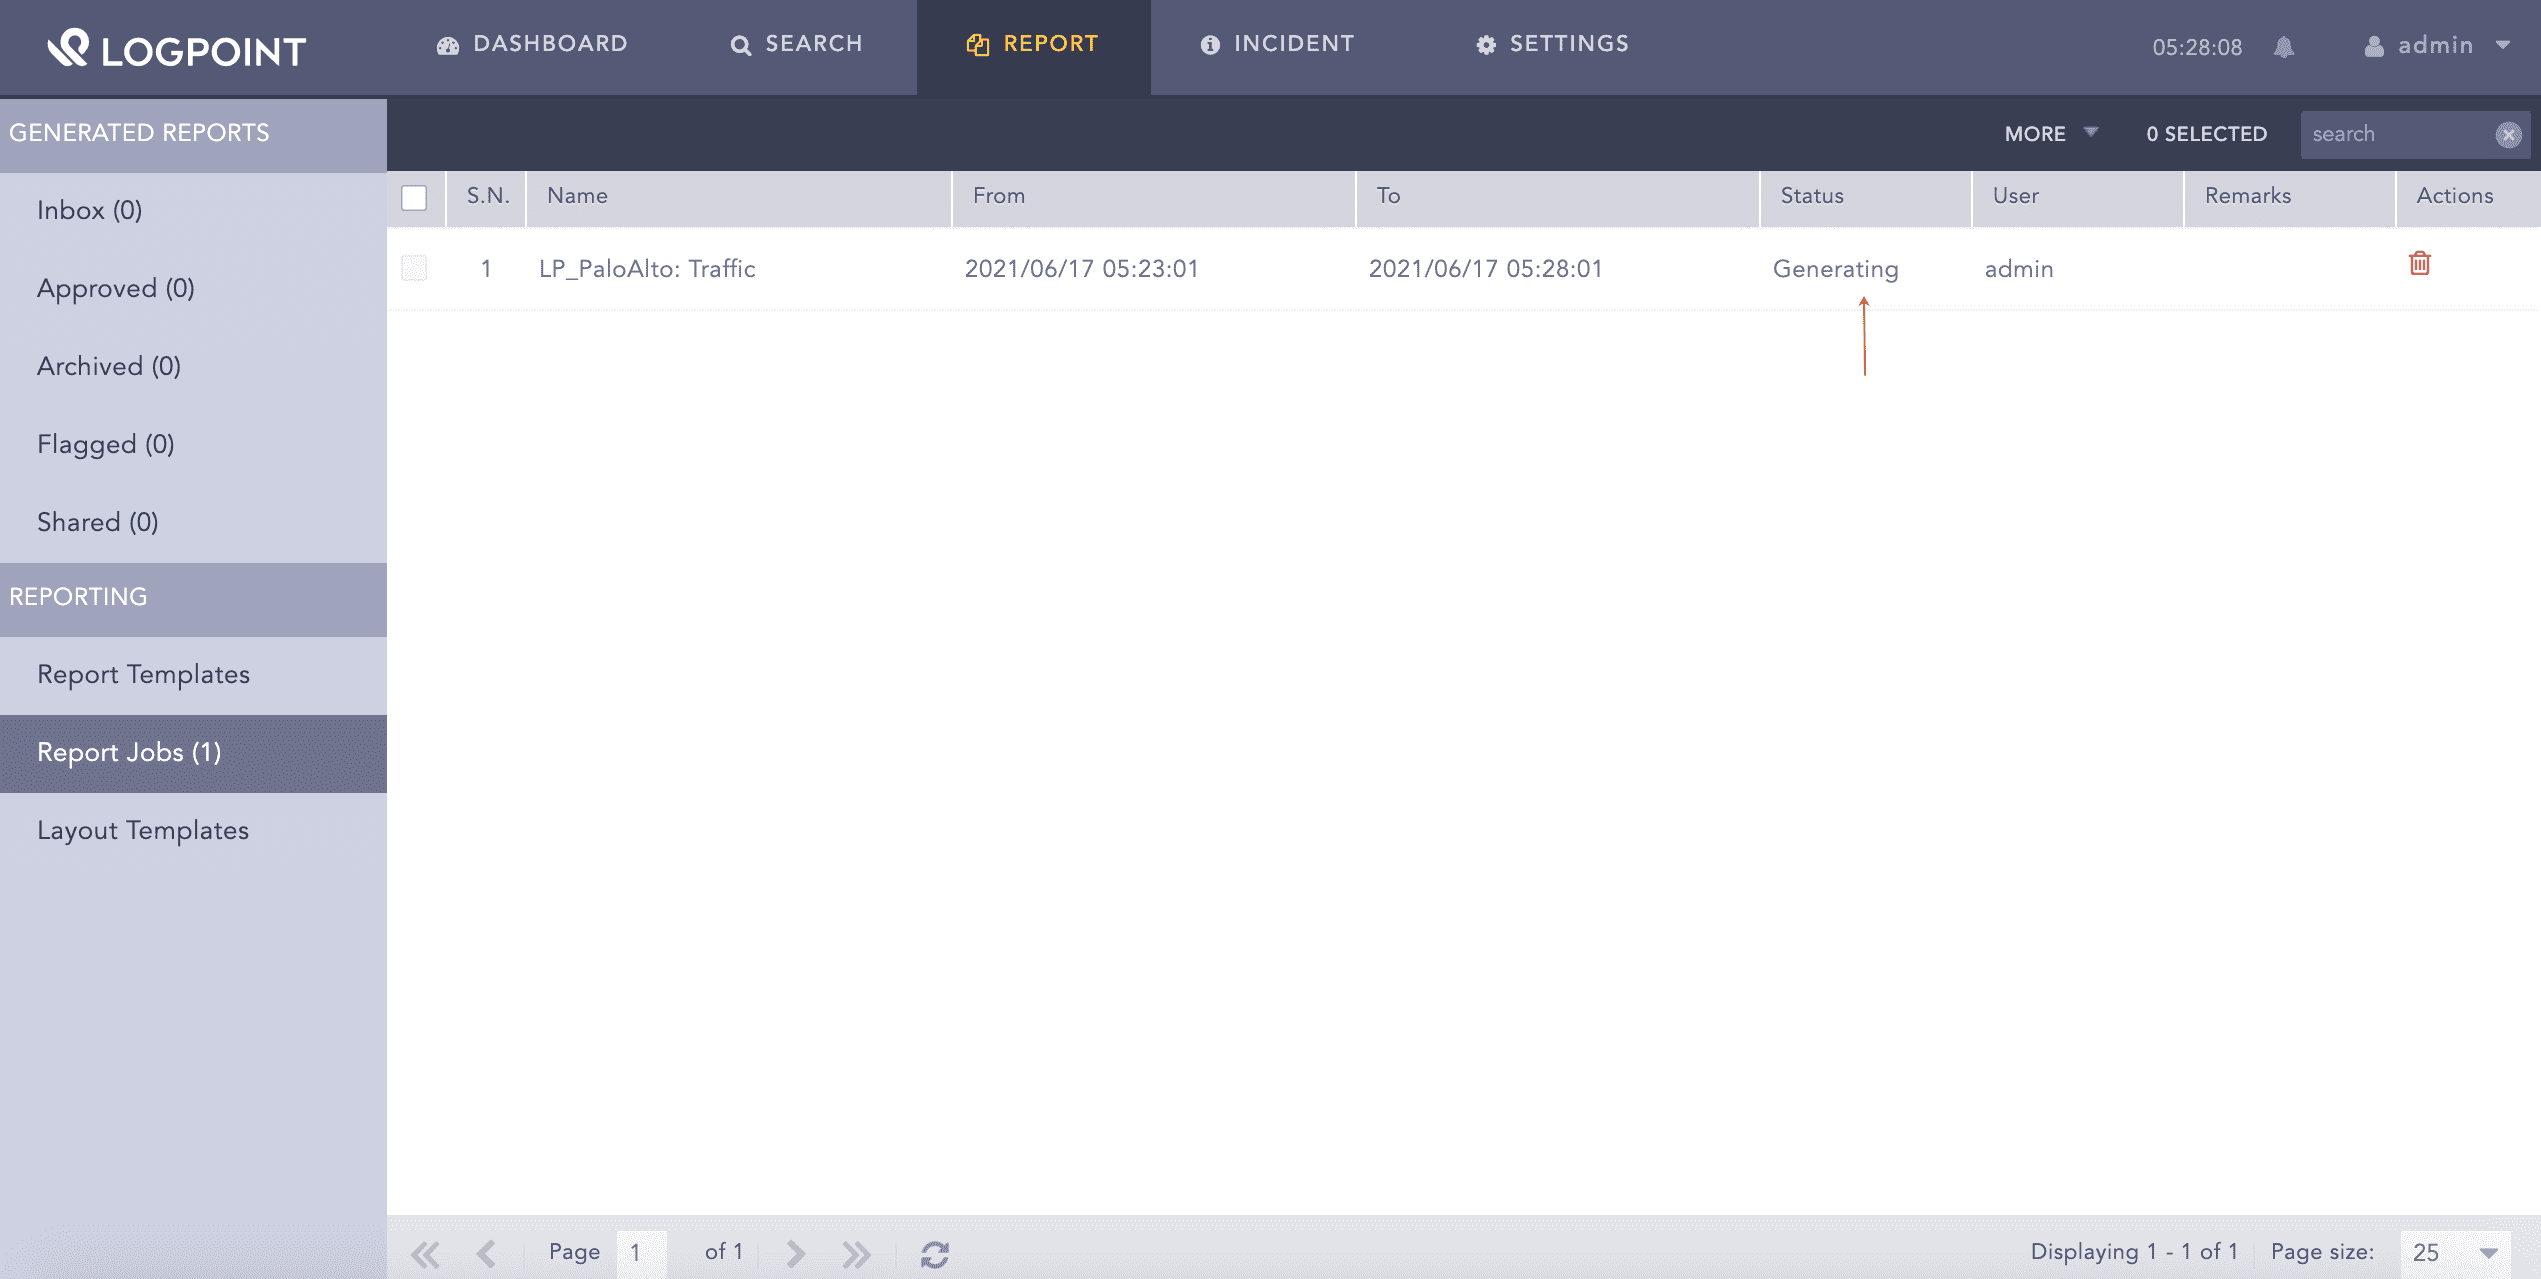
You can view the reports being generated under Report Jobs.
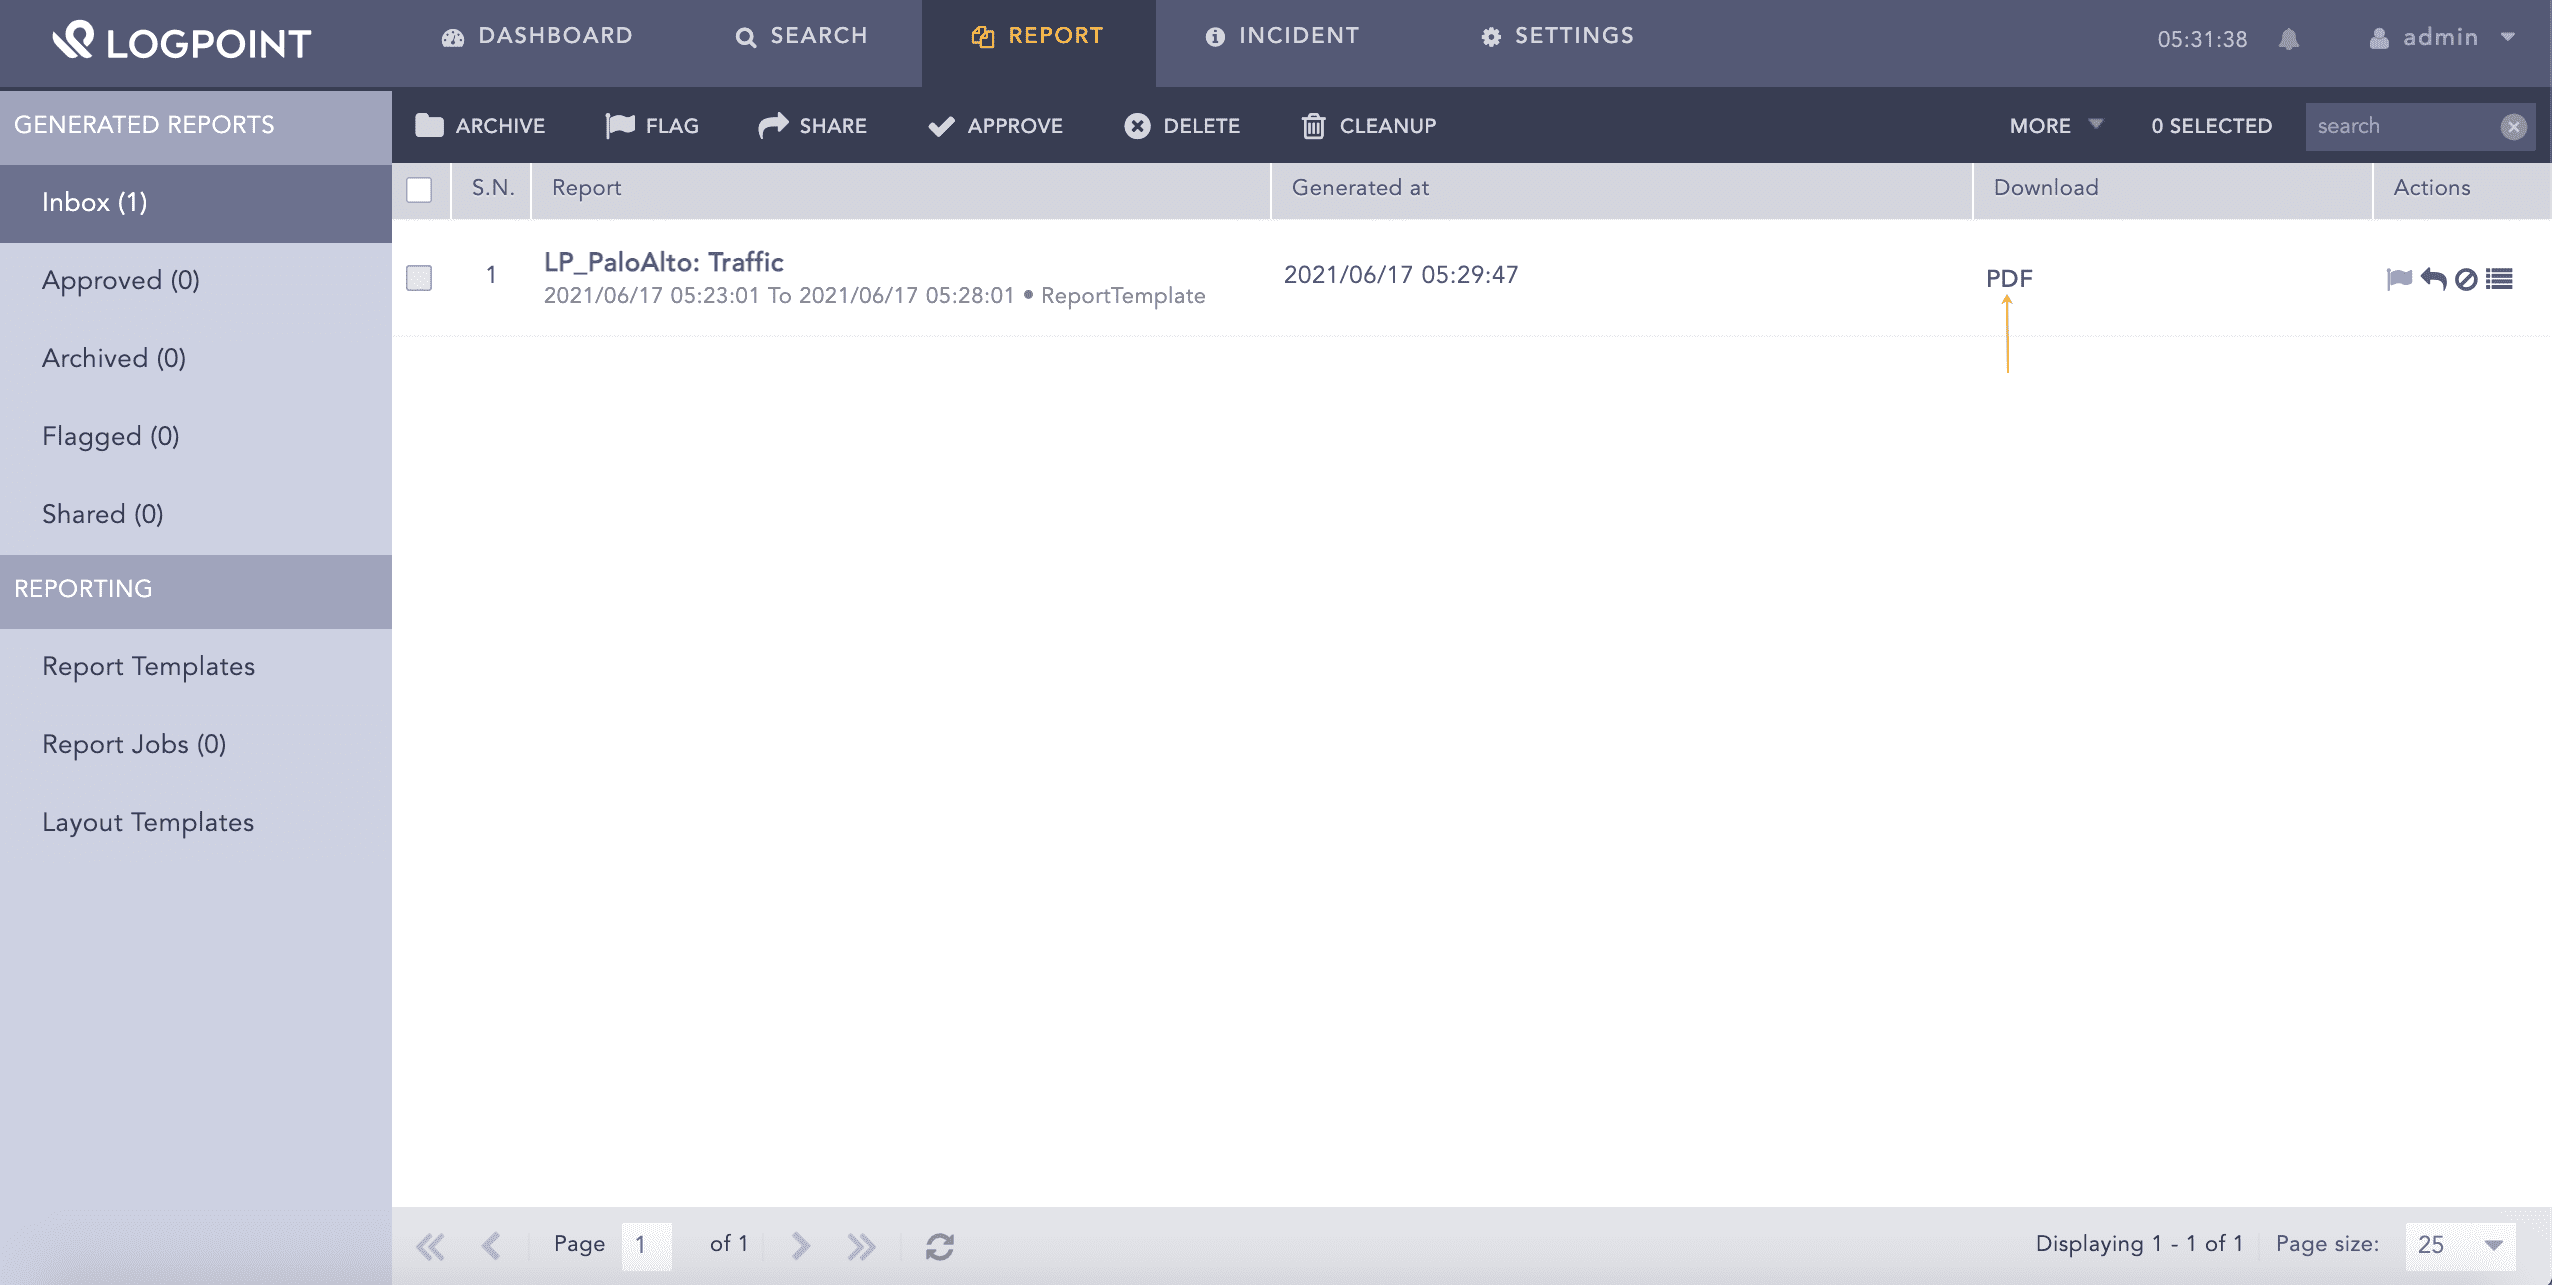
You can view the generated reports from Inbox and download the generated report by clicking PDF under the Download section.
A report contains widgets enabling you to analyze the data in different formats like graphs, time trends, lists, and text. Reports are time-bound, which means they are incident summaries over a period of time, for example, the last 24 hours or last five minutes. While generating a report, you can customize the calendar period according to your needs.
Report templates available in the Palo Alto Network Firewall:
LP_PaloAlto:Firewall is the incident summary report that provides statistical data information on actions performed on firewall and firewall events in different formats such as graphs, time trend, and lists.
LP_PaloAlto:Config Overview is the incident summary report that provides statistical data information on applications allowed or blocked based on bandwidth, their usage, and severity based on the protocol in different formats such as graphs, time trend, and lists.
LP_PaloAlto:General is the incident summary report that provides statistical data information on admin user activities, clients, and configuration overview in different formats such as graphs, time trend, and lists.
LP_PaloAlto:Content Overview is the incident summary report that provides statistical data information on web activities in different formats such as graph and list.
LP_PaloAlto:Threats is the incident summary report that provides statistical data information on files, sources, applications, or IP addresses vulnerable to threats in different formats such as graphs, time trend, and lists.
LP_PaloAlto:Traffic is the incident summary report that provides statistical data information on the flow of traffic through protocols, ports, address, zones, and connections in different formats such as graphs, time trend, and lists.
LP_PaloAlto:System Overview is the incident summary report that provides statistical data information on the status of an object, security status of endpoints, or actions performed on a system in different formats such as graphs, time trend, and lists.